carboon-time

Next cohort Starts

7th Jan, 2025

carbon-calendar

Program duration

11 months

icon-book

Learning Format

Live, Online, Interactive

Why Choose Our Data Analytics Course in Noida?

Noida is a hub for technology and innovation, offering numerous opportunities for aspiring data scientists. Our Data Analytics course in Noida is designed to equip you with the skills and knowledge required to excel in this high-demand field. From Python programming to machine learning, our course covers everything you need to succeed in the data-driven world.

Key Highlights of this Data Analytics Course at IISTP

This comprehensive program ensures you're job-ready and confident to tackle the challenges of the Data Analytics world.

What You’ll Learn in Our Data Analytics course

Our comprehensive course ensures that you master key aspects of Data Analytics:

  • Python for Data Analysis
  • SQL for Data Manipulation
  • Data Visualization with Tableau and Power BI
  • Advanced Excel Techniques
  • Machine Learning Basics
  • Business Intelligence and Reporting Tools

Why Choose Our Data Analytics course in Noida?

icon

Access Multiple Tools

Learn to analyze data effectively using diverse advanced tools.

icon

Live Session

Interactive live sessions with expert guidance and real-time queries.

icon

Multiple Projects

Hands-on experience with multiple real-world Data Analytics projects.

icon

Comprehensive Curriculum

Extensive syllabus covering core and advanced Data Analytics topics.

Course Duration

Duration: 11 months (weekend and weekday batches available)

Fees: ₹60,000 (inclusive of all taxes)

Scholarships: Up to 20% for early enrollments

Small batches with only 8-10 students for better attention. Regular assessments to track your progress.

Agile Activity

Next cohort starts on 7th Jan

:
:

Contact Us

Data Analytics Certification Advantage

IISTP offers a Data Analytics Certification Course in Noida and training in data analysis, machine learning, and big data tools. Designed for beginners and professionals, this course equips you with practical skills in Python, R, SQL, and data visualization. Gain hands-on experience with real-world projects and enhance your career prospects in the rapidly growing Data Analytics industry. Learn from expert instructors and become a certified Data Analytics professional in Noida.

Fast-track your career with our comprehensive Data Analytics Course. Gain industry-relevant skills, hands-on experience, and expert guidance to excel in analytics and business intelligence. Unlock high-paying opportunities and achieve professional growth faster.

Icon
Simplilearn Certificate

Earn Your Data Scientist Certificate

  • Check Industry-recognized certificate by IISTP
  • Check Dedicated live sessions by industry experts
  • Check Lifetime access to self-paced learning content
Icon
IBM Certificate

Get Ahead with IBM Advantage

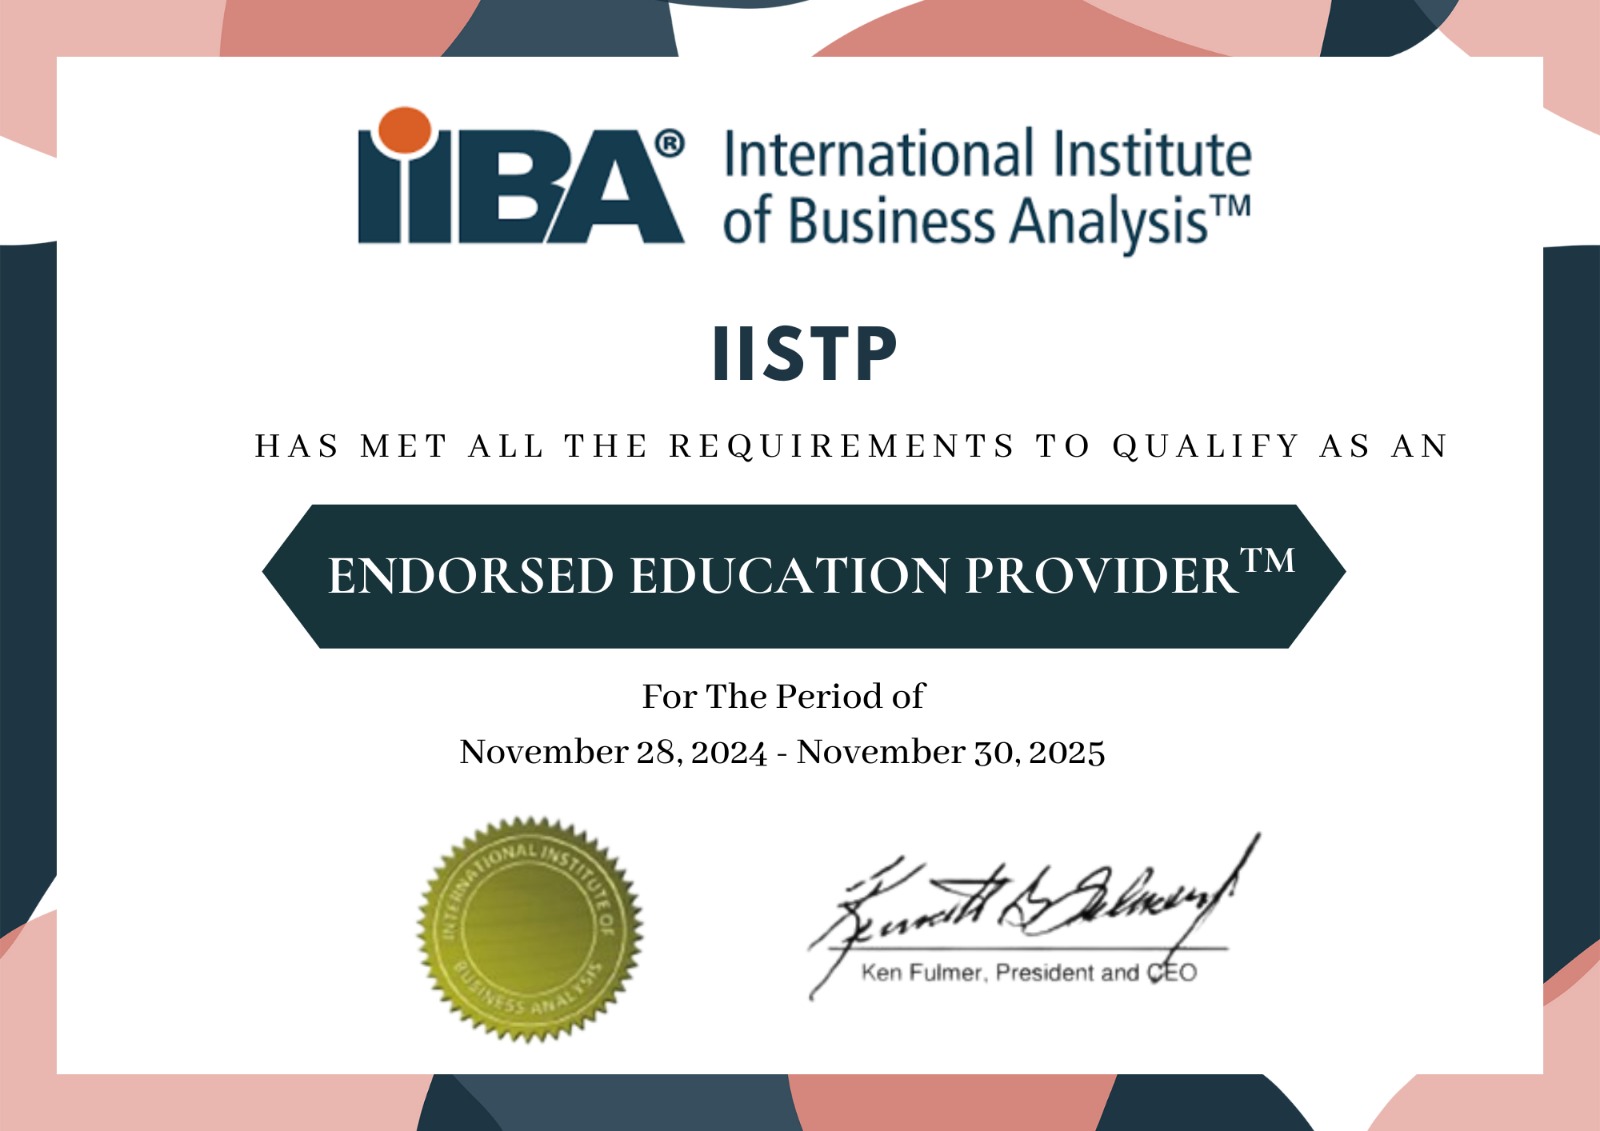
  • Check Content and certificate by NASSCOM & ISO
  • Check Masterclasses by Industry experts
  • Check Interactive Learning Opportunities

Data Analytics course Curriculum Overview

What You’ll Learn in Our Data Analytics course

Python for Data Analytics
Data Analytics Primer and Statistics
Machine Learning
SQL
Excel
Tableau
Power BI
  • Need for Programming
  • Advantages of Programming
  • Overview of Python
  • Organizations using Python
  • Python Applications in Various Domains
  • Python Installation
  • Variables
  • Operands and Expressions
  • Conditional Statements
  • Loops
  • Command Line Arguments
  • Method of Accepting User Input and eval Function
  • Python - Files Input/Output Functions
  • Lists and Related Operations
  • Tuples and Related Operations
  • Strings and Related Operations
  • Sets and Related Operations
  • Dictionaries and Related Operations
  • User-Defined Functions
  • Concept of Return Statement
  • Concept of name = "main"
  • Function Parameters
  • Different Types of Arguments
  • Global Variables
  • Global Keyword
  • Variable Scope and Returning Values
  • Lambda Functions
  • Various Built-In Functions
  • Introduction to Object-Oriented Concepts
  • Built-In Class Attributes
  • Public, Protected and Private Attributes, and Methods
  • Class Variable and Instance Variable
  • Constructor and Destructor
  • Decorator in Python
  • Core Object-Oriented Principles
  • Inheritance and Its Types
  • Method Resolution Order
  • Overloading
  • Overriding
  • Getter and Setter Methods
  • Inheritance-In-Class Case Study
  • Standard Libraries
  • Packages and Import Statements
  • Topics: Working with Modules and Handling Exceptions
  • [email protected] | +91-7701928515 | www.uncodemy.com
  • Reload Function
  • Important Modules in Python
  • Sys Module
  • Os Module
  • Math Module
  • Date-Time Module
  • Random Module
  • JSON Module
  • Regular Expression
  • Exception Handling
  • Basics of Data Analysis
  • NumPy - Arrays
  • Operations on Arrays
  • Indexing, Slicing, and Iterating
  • NumPy Array Attributes
  • Matrix Product
  • NumPy Functions
  • Functions
  • Array Manipulation
  • File Handling Using NumPy
  • Array Creation and Logic Functions
  • File Handling Using NumPy
  • Introduction to pandas
  • Data Structures in pandas
  • Series
  • Data Frames
  • Importing and Exporting Files in Python
  • Basic Functionalities of a Data Object
  • Merging of Data Objects
  • Concatenation of Data Objects
  • Types of Joins on Data Objects
  • Data Cleaning using pandas
  • Exploring Datasets
  • What is Data Analytics ?
  • What does Data Analytics involve?
  • Era of Data Analytics
  • Business Intelligence vs Data Analytics
  • Life cycle of Data Analytics
  • Tools of Data Analytics
  • Application of Data Analytics
  • Introduction
  • Stages of Analytics
  • CRISP DM Data Life Cycle
  • Data Types
  • Introduction to EDA
  • First Business Moment Decision
  • Second Business Moment Decision
  • Third Business Moment Decision
  • Fourth Business Moment Decision
  • Correlation
  • What is Feature
  • Feature Engineering
  • Feature Engineering Process
  • Benefit
  • Feature Engineering Techniques
  • Basics Of Probability
  • Discrete Probability Distributions
  • Continuous Probability Distributions
  • Central Limit Theorem
  • Concepts Of Hypothesis Testing - I: Null And Alternate Hypothesis, Making A Decision, And Critical Value Method
  • Concepts Of Hypothesis Testing - II: P-Value Method And Types Of Errors
  • Industry Demonstration Of Hypothesis Testing: Two-Sample Mean And Proportion Test, A/B Testing
  • Simple Linear Regression
  • Simple Linear Regression In Python
  • Multiple Linear Regression
  • Multiple Linear Regression In Python
  • Industry Relevance Of Linear Regression
  • Univariate Logistic Regression
  • Multivariate Logistic Regression: Model
  • Building And Evaluation
  • Logistic Regression
  • Industry Applications
  • Data mining classifier technique
  • Application of KNN classifier
  • Lazy learner classifier
  • Altering hyperparameter(k) for better accuracy
  • Black box
  • SVM hyperplane
  • Max margin hyperplane
  • Kernel tricks for non-linear spaces
  • Rule based classification method
  • Different nodes for developing decision trees
  • Discretization
  • Entropy
  • Greedy approach
  • Information gain
  • Introduction to Databases
  • How to create a Database instance on Cloud?
  • Provision a Cloud hosted Database instance.
  • What is SQL?
  • Thinking About Your Data
  • Relational vs. Transactional Models ER Diagram
  • CREATE Table Statement and DROP tables
  • UPDATE and DELETE Statements
  • Retrieving Data with a SELECT Statement
  • Creating Temporary Tables
  • Adding Comments to SQL
  • Basics of Filtering with SQL
  • Advanced Filtering: IN, OR, and NOT
  • Using Wildcards in SQL
  • Sorting with ORDER BY
  • Math Operations
  • Aggregate Functions
  • Grouping Data with SQL
  • Using Subqueries
  • Subquery Best Practices and Considerations
  • Joining Tables
  • Cartesian (Cross) Joins
  • Inner Joins
  • Aliases and Self Joins
  • Advanced Joins: Left, Right, and Full Outer Joins
  • Unions
  • Working with Text Strings
  • Working with Date and Time Strings
  • Date and Time Strings Examples
  • Case Statements
  • Views
  • Data Governance and Profiling
  • Using SQL for Data Science
  • How to access databases using Python?
  • Writing code using DB-API
  • Connecting to a database using DB API
  • Create Database Credentials
  • Connecting to a database instance
  • Creating tables, loading, inserting, data and querying data
  • Analysing data with Python
  • Input data & handling large spreadsheets
  • Tricks to get your work done faster
  • Automating data analysis (Excel VLOOKUP, IF Function, ROUND and more)
  • Transforming messy data into shape
  • Cleaning, Processing and Organizing large data
  • Spreadsheet design principles
  • Drop-down lists in Excel and adding data validation to the cells
  • Creating Charts & Interactive reports with Excel Pivot Tables, PivotCharts, Slicers and Timelines
  • Functions like: - COUNTIFS, COUNT, SUMIFS, AVERAGE and many more
  • Excel features: - Sort, Filter, Search & Replace, Go to Special, etc...
  • Importing and Transforming data (with Power Query)
  • Customize the Microsoft Excel interface
  • Formatting correctly for professional reports
  • Commenting on cells
  • Automate data entry with Autofill and Flash-fill
  • Writing Excel formulas & referencing to other workbooks/worksheets
  • Printing options
  • Charts beyond column and bar charts: - Pareto chart, Histogram, Treemap, Sunburst
  • Charts & more
  • Introduction to Data Visualization
  • Tableau Introduction and Tableau Architecture
  • Exploring Data using Tableau
  • Working with Data using Tableau including Data Extraction and Blending
  • Various Charts in Tableau (Basics to Advanced)
  • Sorting-Quick Sort, Sort from Axis, Legends, Axis, Sort by Fields
  • Filtering- Dimension Filters, Measure Filters, Date Filters, Tableau Context Filters
  • Groups, Sets and Combined Sets
  • Reference Lines, Bands and Distribution
  • Parameters, Dynamic Parameters and Actions
  • Forecasting-Exponential Smoothing Techniques
  • Clustering
  • Calculated Fields in Tableau, Quick Tables
  • Tableau Mapping Features
  • Tableau Dashboards, Dashboards Action and Stories
  • Introduction to Power BI – Need, Importance
  • Power BI – Advantages and Scalable Options
  • Power BI Data Source Library and DW Files
  • Business Analyst Tools, MS Cloud Tools
  • Power BI Installation
  • Power BI Desktop – Installation, Usage
  • Sample Reports and Visualization Controls
  • Understanding Desktop & Mobile Editions
  • Report Rendering Options and End User Access
  • Input data & handling large spreadsheets
  • Tricks to get your work done faster
  • Automating data analysis (Excel VLOOKUP, IF Function, ROUND, and more)
  • Transforming messy data into shape
  • Cleaning, Processing, and Organizing large data
  • Spreadsheet design principles
  • Drop-down lists in Excel and adding data validation to cells
  • Creating Charts & Interactive reports with Excel Pivot Tables, PivotCharts, Slicers, and Timelines
  • Functions like: COUNTIFS, COUNT, SUMIFS, AVERAGE, and many more
  • Excel features: Sort, Filter, Search & Replace, Go to Special, etc.
  • Importing and Transforming data (with Power Query)
  • Customize the Microsoft Excel interface
  • Formatting correctly for professional reports
  • Commenting on cells
  • Automating data entry with Autofill and Flash-fill
  • Writing Excel formulas & referencing other workbooks/worksheets
  • Printing options
  • Charts beyond column and bar charts: Pareto chart, Histogram, Treemap, Sunburst, and more
  • Introduction to Data Visualization
  • Tableau Introduction and Tableau Architecture
  • Exploring Data using Tableau
  • Working with Data using Tableau, including Data Extraction and Blending
  • Various Charts in Tableau (Basics to Advanced)
  • Sorting: Quick Sort, Sort from Axis, Legends, Axis, Sort by Fields
  • Filtering: Dimension Filters, Measure Filters, Date Filters, Tableau Context Filters
  • Groups, Sets, and Combined Sets
  • Reference Lines, Bands, and Distribution
  • Parameters, Dynamic Parameters, and Actions
  • Forecasting: Exponential Smoothing Techniques
  • Clustering
  • Calculated Fields in Tableau, Quick Tables
  • Tableau Mapping Features
  • Tableau Dashboards, Dashboard Actions, and Stories
  • Introduction to Power BI – Need, Importance
  • Power BI – Advantages and Scalable Options
  • Power BI Data Source Library and DW Files
  • Business Analyst Tools, MS Cloud Tools
  • Power BI Installation
  • Power BI Desktop – Installation, Usage
  • Sample Reports and Visualization Controls
  • Understanding Desktop & Mobile Editions
  • Report Rendering Options and End User Access
  • Report Design with Database Tables
  • Report Visuals, Fields, and UI Options
  • Reports with Multiple Pages and Advantages
  • Pages with Multiple Visualizations. Data Access
  • “GET DATA” Options and Report Fields, Filters
  • Report View Options: Full, Fit Page, Width Scale
  • Report Design using Databases & Queries

Tools and Technologies You'll Master

Data Analytics Job Opportunities in Noida

Noida is home to numerous IT companies, startups, and multinational corporations, making it an ideal location to start your career in Data Analytics . According to recent reports:

image

10,000+ job openings

Data Analytics and related fields in Noida.

image

Top Companies

TCS, Accenture, IBM, and Infosys are actively hiring data scientists.

image

Average starting salary:

₹6-8 LPA for freshers and ₹15+ LPA for experienced professionals.

What Makes Us the Best Data Analytics Institute in Noida?

Stock Price Prediction using Machine Learning

Predict future stock prices using historical data and machine learning algorithms

  • ✅ Use Python and machine learning libraries like Scikit-learn
  • ✅ Work with real-world stock data and clean it
  • ✅ Implement linear regression, decision trees, and time-series analysis
  • ✅ Train models to predict future stock movements

In Collaboration with

Finance Expert
Tools Used
Python Scikit-learn Pandas

Build a Career Plan with our Data Analytics Training in Noida

Fast-track your career with our comprehensive Data Analytics course. Gain industry-relevant skills, hands-on experience, and expert guidance to excel in data analytics, machine learning, and AI. Unlock high-paying opportunities and achieve professional growth faster.

icon

150%

Maximum salary hike

icon

70%

Average salary hike

icon

2900+

Hiring partners

Our Alumni In Top Companies

Amazon Amity JustDial IBM Adobe Walmart Deloitte BlooHash Nasscomm AppInventiv

What Our Learners Have To Say

How to Select the Best Specialization for Your Data Analytics Course in Noida

Choosing the right specialization for your Data Analytics Course in Noida is essential to carving a successful career in this dynamic and in-demand field. With multiple pathways and industry-specific requirements, making an informed choice will help align your learning journey with your professional goals. Below are some key points to guide you in selecting the best specialization for your needs:

1. Understand the Scope of Data Analytics Specializations

The field of data analytics offers a variety of specializations, each catering to unique skill sets and career paths. Some popular options include:

  • Business Analytics: Ideal for professionals aiming to leverage data to drive strategic decisions in business environments.
  • Predictive Analytics: Focused on forecasting trends and outcomes using statistical models and machine learning techniques.
  • Marketing Analytics: Perfect for individuals interested in consumer behavior and targeted marketing strategies.
  • Healthcare Analytics: Concentrates on improving healthcare services through data-driven insights and efficiency optimization.
  • Financial Analytics: Involves analyzing financial data to help businesses make informed fiscal decisions.

Research these specializations thoroughly to understand their scope, tools used, and industry relevance.

2. Align with Your Career Goals

Define your career aspirations to narrow down the most suitable specialization:

  • Interested in solving business challenges? Choose Business Analytics.
  • Want to work in marketing teams or agencies? Opt for Marketing Analytics.
  • Passionate about data in the financial or healthcare sectors? Explore Financial or Healthcare Analytics.
  • Keen on technical roles like Predictive Analyst or Data Modeler? Predictive Analytics might be your best fit.

Your career goals will serve as a compass in selecting the right specialization.

3. Evaluate Your Skills and Interests

Your skills and interests should match the specialization you choose:

  • Enjoy problem-solving and strategic thinking? Business Analytics is a great option.
  • Comfortable with coding and algorithms? Predictive Analytics might suit you.
  • Excel at statistical analysis and reporting? Marketing or Financial Analytics could be the right choice.

Take a moment to assess your current skill set and passion for different aspects of data analytics.

4. Review the Curriculum Offered by Data Analytics Institutes in Noida

Ensure the curriculum of your chosen Data Analytics Institute in Noida includes:

  • A balanced mix of foundational and advanced topics.
  • Hands-on training with real-world projects and case studies.
  • Exposure to industry-standard tools like Python, R, Tableau, SQL, and Power BI.
  • Support for certifications such as Microsoft Data Analyst, Google Data Analytics, or Tableau Certified Data Analyst.

Practical experience and industry-relevant content are critical for success.

5. Stay Updated with Market Trends

Data analytics is rapidly evolving with emerging specializations and tools. Look for a course that covers:

  • Advanced techniques like Machine Learning in Analytics or NLP.
  • Tools and platforms for Big Data and Cloud Analytics.
  • The latest trends in AI-driven analytics.

Choose a specialization that prepares you for the future demands of the job market.

6. Seek Expert Guidance

Consult with industry professionals, alumni from leading Data Analytics Institutes in Noida, and career counselors. Their advice can provide clarity and help you identify the right specialization.

7. Prioritize Accreditation and Certification

A recognized certification from a reputed Data Analytics Institute in Noida significantly enhances your employability and professional credibility. Verify the course’s accreditation and its acceptance in the job market before enrolling.

Final Thoughts

Selecting the right specialization is a pivotal step in your data analytics journey. By aligning your interests, skills, and career goals with market demands, you can position yourself for long-term success.

If you’re ready to embark on an exciting career in data analytics, explore our Data Analytics Courses in Noida today. With industry-recognized certifications, expert mentorship, and hands-on training, we provide everything you need to thrive in this competitive field. Let us help you take the first step toward achieving your career aspirations!


...Read More

Career Services

counsellor
assistance Placement Assistance
job-portal Exclusive access to intellipat job portal
mock-interview Mock Interview Preparation
career-session One-on-One Career Mentoring Sessions
career-session Career Oriented Sessions
resume-profile Resume & LinkedIn Profile Building

Apply Now

Contact Us

Program Benefits

  • Masterclasses delivered by Purdue faculty and staff and IBM
  • Data Analytics and GenAI program completion certificate
  • Exposure to ChatGPT, GenAI, prompt engineering, and more
  • Alumni Association Membership from Purdue University
  • Simplilearn’s Career Assistance post program completion

F.A.Q

1. What is the eligibility for this course?

Graduates in any discipline with basic programming knowledge can apply. Even working professionals looking to switch careers can join.

3. Is this course suitable for beginners?

Absolutely! Our Data Analytics course in Noida starts with the basics and gradually moves to advanced topics, making it ideal for beginners and professionals alike.

5. Do you offer placement assistance?

Yes, we at IISTP provide 100% placement support, including resume building, mock interviews, and job referrals to top companies.

7. What is the mode of training?

We offer both online and classroom training. You can choose whichever suits your schedule best.

9. What tools and technologies will I learn in this course?

You’ll gain hands-on experience with tools like Python, R, SQL, Tableau, Power BI, and machine learning frameworks like TensorFlow and Scikit-learn.

11. What are the class timings?

We offer flexible batch timings, including weekday and weekend options, to cater to both students and working professionals.

13. Will I get a certificate after completing the course?

Yes, you will receive an industry-recognized certificate upon successfully completing the course.

15. What kind of projects will I work on?

You will work on real-world projects like predictive analytics, recommendation systems, sentiment analysis, and more, using actual datasets.

17. Is there a demo class available?

Yes, we offer a free demo class to help you understand the course structure and teaching methodology.

19. Are there any scholarships or discounts available?

Yes, we offer scholarships and early-bird discounts of up to 20% for eligible candidates.

2. What career roles can I expect after completing this course?

You can pursue roles such as Data Scientist, Data Analyst, Machine Learning Engineer, Business Analyst, or AI Specialist.

4. Do I need prior programming knowledge to join?

Basic programming knowledge is helpful but not mandatory. We provide foundational programming sessions as part of the course.

6. How can I enroll in the course?

You can enroll by filling out the online registration form or visiting our Noida center. For assistance, contact our support team.

8. What happens if I miss a class?

All sessions are recorded, and you’ll have access to the recordings, so you can revisit any missed classes.

10. Can I switch batches if needed?

Yes, batch switching is allowed based on availability and your convenience.

12. Is this course aligned with industry standards?

Absolutely! Our curriculum is updated regularly to align with the latest industry trends and demands.

14. What is the average salary of a Data Scientist in Noida?

The average starting salary for a Data Scientist in Noida is ₹6-8 LPA, with experienced professionals earning ₹15+ LPA.

16. Can I pay the fees in installments?

Yes, we offer EMI options to make it easier for you to afford the course.

18 How do I know if Data Analytics is the right career for me?

If you enjoy solving problems, working with data, and learning new technologies, Data Science could be a perfect fit. Our counselors can help you decide during a free consultation.

20. Will I receive career guidance during the course?

Yes, we provide career counseling, resume preparation, mock interviews, and placement assistance to ensure you are job-ready.